Usage of trading indicators is a part of any trader’s trading strategy. The trading indicators are the mathematical calculations or indications that are plotted as lines on a price chart implying the trends and signals to help traders within the market.
As explained in a previous blog, there are several types of indicators - leading, lagging, and confirming indicators. Any indicator that a trader use falls under any of these three categories. When the leading indicators provide early alerts and trade signals, the lagging indicators, also known as trend-following indicators help in assessing market trends and removing market noises to provide more insight into the trend. Confirming Indicators, as the name says, confirm or validate the price analysis.
As mentioned before, the lagging indicators are the trend-following indicators. It looks at and analyzes the past trends and indicates momentum. Let us see the top trend indicators that work.
1. Moving Average (MA)
The moving average (MA) or Simple Moving Average (SMA) indicator identifies the direction of the live price trend. It also identifies the support and resistance levels. Thus, the Moving Average calculation helps to mitigate the impacts of short-term fluctuations in price over a specific or particular time frame. As the moving average indicator is calculated using the progressive average price of the past days, months, or hours, the moving average indicator is considered as the most effective trend indicator for trading. There are numerous configurations for the MA indicator, but still, they can be used for any time frame and any price.
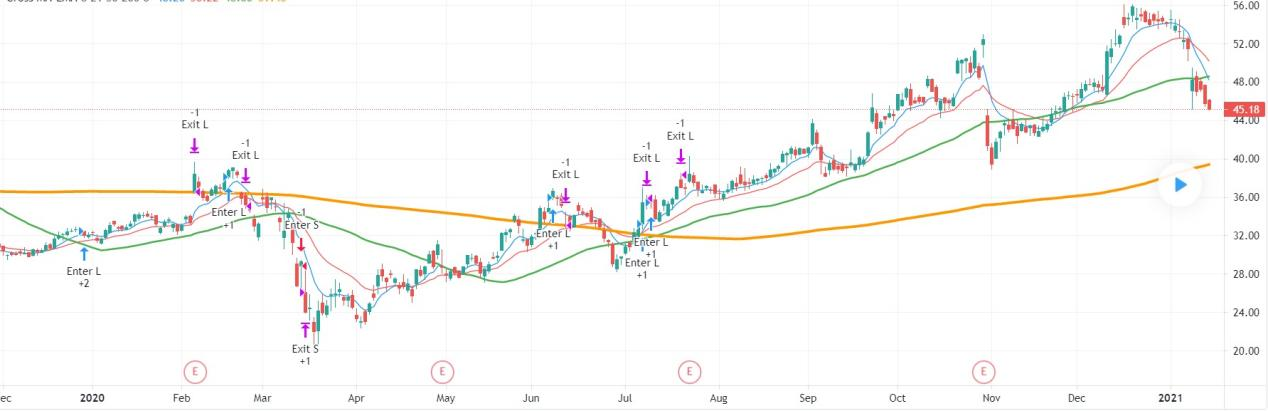
EMA and SMA combined. Image Source: Trading View
The Exponential Moving Average (EMA) is another form of the Moving Average indicator. This indicator uses the recent data points or prices to make the data more responsive and relevant. EMA when used along with any other indicators can confirm the significant market moves and their legitimacy. The most popular EMAs for short-term trend trading is 12-day EMA and 26-day EMAs, while on the contrary 50-day EMAs and 200-day EMAs are popular for long-term trend trading.
2. Moving Average Convergence Divergence (MACD)
The Moving Average Convergence/Divergence (MACD) indicator is one of the trend-following momentum oscillators/indicators used by the traders. The MACD indicator appears as two lines (two moving averages) that moves across the chart without any boundaries. The crossover of the two lines works similar to that of a moving average indicator is giving signals, and it helps the traders to buy and sell around the support and resistance levels.
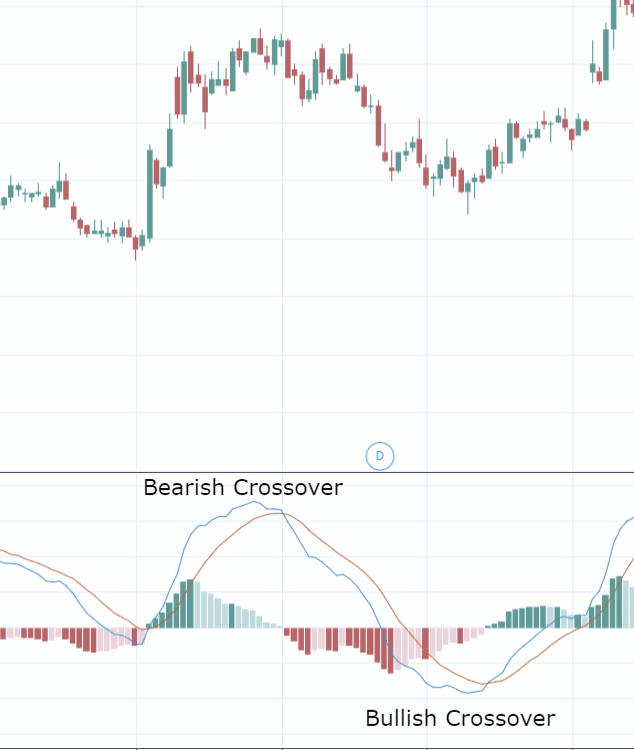
Image Source: Trading View
Convergence points out that two lines are coming together which indicates that momentum is decreasing (bearish trend). In contrast, the divergence points out that two lines diverge from each other which signals the increase in momentum (bullish trend). MACD is calculated by finding the difference between a 26-day EMA and a 12-day exponential moving average. That is, MACD = 12-day EMA − 26-day EMA implying 9-day EMA. This means that the signal line is generated with the 9-day EMA of the MACD line. (Remember this is the default calculation and these parameters can be changed).
3. Bollinger Bands
Bollinger Bands is another trend following indicator that is widely used by traders. This indicator measures price volatility (the degree of variation of a trading price). Three bands define the Bollinger Bands - two outer bands and a middle band. There are two parameters defining the Bollinger Bands - SMA and the standard deviation. The Simple Moving Average (SMA) functions as the base for two outer bands. The upper band is taken by adding twice the standard deviation of SMA, whereas the lower band is taken by reducing twice the standard deviation of SMA. The default simple moving average is the 20-day SMA.
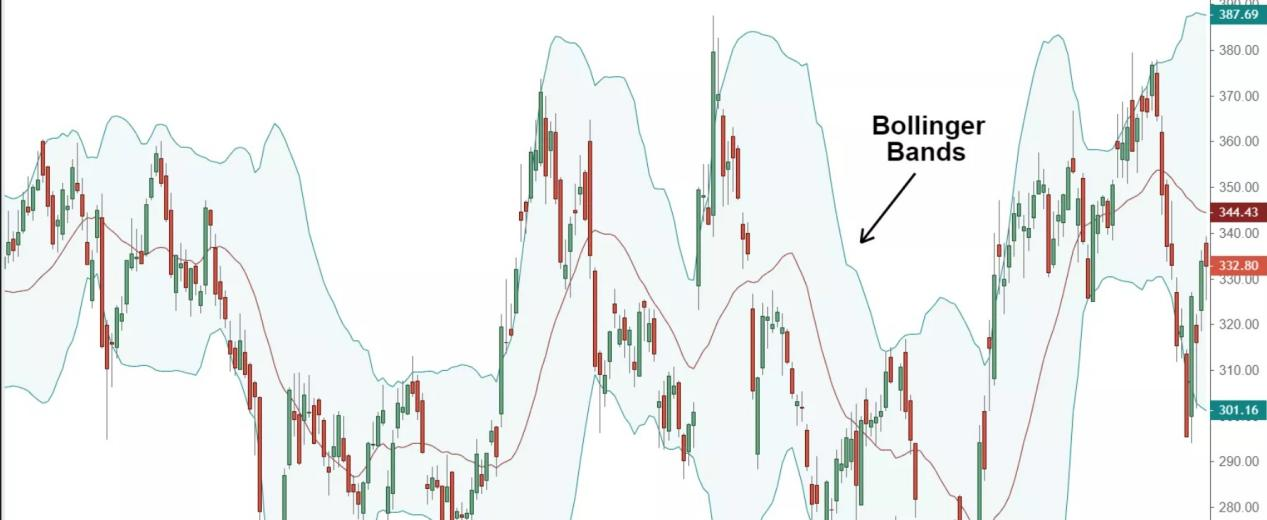
Image Source: Trading View
When the bands get closer or narrower, the volatility of the financial instrument can be considered lower. Whereas, when the bands get wider, the volatility can be considered higher. Bollinger bands are most widely used among traders to predict long-term price movements. It can be said that when a price moves exceeding the upper parameters of the band continuously, it could be overbought. In contrast, when the price moves beyond the lower band continually, it could be oversold.
4. Relative Strength Index (RSI)
Relative strength index (RSI) is another trend-following indicator used by traders. This technical analysis tool or indicator measures the volume of past price fluctuations to assess the overbought or oversold price conditions of a financial instrument. The RSI indicator is displayed as a line graph that typically oscillates between two extremes having a reading between 0 to 100, which provides signals about bullish and bearish price momentum.
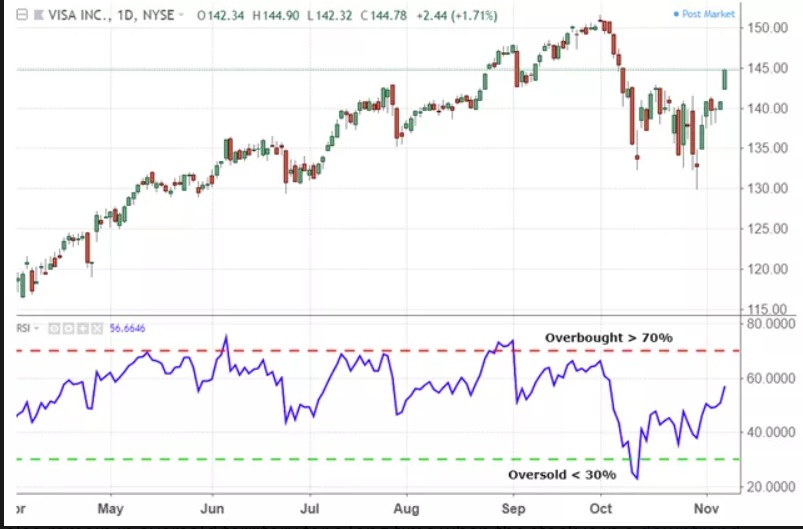
Image Source: Trading View
The RSI is determined using average price gains as well as losses throughout a given time frame. The default time frame is 14 periods with values limited from 0 to 100. The RSI increases with the rise in positive closes and RSI falls with the increase in losses. An asset is generally considered to be overbought or overvalued when the RSI reading is above 70% and can be considered to be oversold or undervalued when the reading is below 30%. An overbought signal indicates that short-term gains may be reaching maturity point and the assets may be in for a price change. Conversely, an oversold signal could imply that short-term downturns are reaching maturity and assets may be in for a rally.
5. On Balance Volume (OBV)
On Balance Volume (OBV) is a momentum/ trend-following indicator that uses volume changes to make predictions on price changes of financial instruments. The OBV indicator provides sum of the asset's trading volume and signals whether this volume is streaming in or out of a given security or forex pair. Three standards executed while ascertaining the OBV are given as follows:
- Assuming the present closing price is higher than the previous closing value, then Current OBV = Previous OBV + the present volume
- On the off chance that the present closing price is lower than the previous closing price, Current OBV = Previous OBV - Present Volume
- In the event that the present shutting value rises to the previous shutting value, Current OBV = Previous OBV
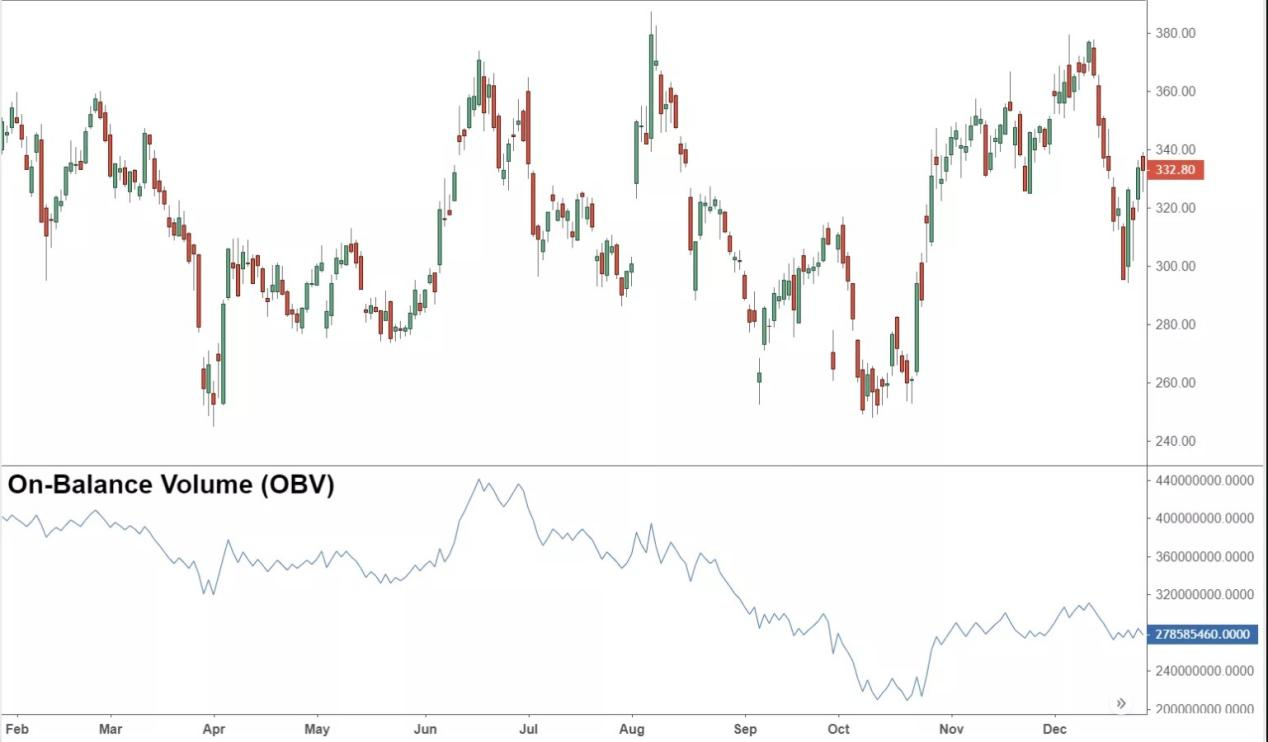
Volume is a significant correlative measure that is utilized to confirm price drifts and trends by discerning if they turn out on a higher or a lower number of trades. By and large, a high number of trades going with an upward trend is a supporting sign for that trend and the equivalent for a low number of trades with a downward trend.
Conclusion
Traders of all trading choices prefer utilizing trend-following indicators to amplify price movements in the market. Nevertheless, trend trading is not just simply buying and selling assets in the rising and falling market. Trend trading depends on several technical indicators and understanding these indicators will help you better in your trades. Notwithstanding, as a trend trader, it is also important to keep your strategies and trade plans as simple as possible, as it can help you to avoid curve fitting.